Searching for a specific document out of millions can be a daunting task, particularly if you don’t know what you’re searching for. Often the title is on the tip of your tongue, and you would know it if you saw it. Wouldn’t it be nice if search tools accommodated for vague criteria just as easily as pinpoint queries? What if users could take a heap of guesses and whittle it down into a small set of relevant results?
We set about to solve this problem for WebCenter Content by leveraging a tool designed to handle massive amounts of data. Microsoft’s PivotViewer feeds off data sources and molds them into views for the end user to consume. The most popular example of this technology in action is the Netflix catalog at where 1000 movies from Netflix Instant can be pulled down and organized by year, cast, rating, and more. The applications for such powerful control over this data are clear for anyone who can’t remember the name of the movie that starred so-and-so and was released at the turn of the century. We immediately recognized the value of this within the domain of Digital Asset Management, and so we brought it to WebCenter.
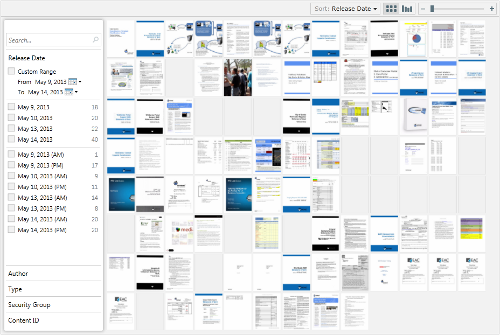
PivotViewer is a control for Microsoft Silverlight, which is installed as a browser plugin much like Flash. Once it receives a collection of data that it can understand, PivotViewer organizes the data by common attributes called facets, allowing documents to be sorted and filtered on any metadata field. The thumbnail rendition is pulled in to represent the document in the canvas. Silverlight operates asynchronously, meaning that it doesn’t need to wait for every image to download before it can be used.

PivotViewer Grid View
This control is made accessible on the main search result page. In practice, users can perform a quick search for latest documents or use existing search methods to gather a large set of documents, and drill down from those results using PivotViewer. All that it needs is a QueryText parameter in the URL.
For example, say I was looking for a Powerpoint presentation that held an important piece of information, but I could only reliably identify it by its red background. I would first use the full-text search for fragments of content, narrowing candidates down to 200 or so results. These would be piped into PivotViewer to show two-dozen red-colored documents. Using the metadata filters, I would select the Presentation document type and the date range of its release, yielding 2 documents. This process allows quick retrieval in spite of the vague search criteria, and is much more precise than wading through 10 pages of possibilities.

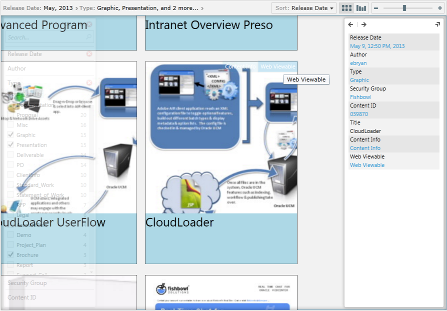
Zoom-in details with quick links to the content info page and web viewable
Selecting a document brings up a short list of content information; these fields can be customized for each distribution of the component. Each of these fields is a hyperlink that can quickly create a filter on its value. Say that a collection of documents was checked in together: by finding one document and filtering on its Release Date and Document Type, the entire collection is immediately available to me. I can also create a filter across all fields with a keyword search.

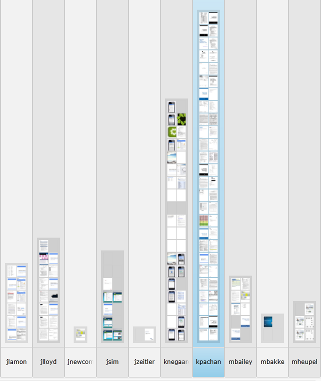
Pivoting with PivotViewer
Complementing the default grid layout is a bar chart representation of results along any metadata field. This view is helpful for identifying patterns within data, allowing me to actively pivot on fields and drill down on interesting pockets of documents. Every action is recorded in a breadcrumb trail at the top of the control, so if I ever get lost, a few clicks will undo the filters I’ve added and get me back to where I was.
All of these features are packed into a content server component and ready to be installed in a few clicks. Contact our sales team at sales@fishbowlsolutions.com to discuss your search needs and schedule a demo.

0 Comments