A key piece of a successful search solution is being able to see how the users are interacting with the system and using relevant data to make improvements over time. This blog post will go through the steps of enabling Mindbreeze’s Advanced Query Reporting and how to scope it to the search of one specific application.
Starting in the Mindbreeze Management Center, go to Reporting → Query Logs. If the Personalized Relevance Transformer has not been enabled, this message will appear:
Enable the Personalized Relevance Transformer and use the default settings. In the Management Center, go to Configuration → Indices. Under the “Services” area, click “+ Add Service”.

Change the type to PersonalizedRelevanceTransformer and give it a name. Leave the rest of the settings defaulted and click save.

After giving the service a couple minutes to start up, go back to the Query Logs page and you will now see a new interface in the PersonalizedRelevanceTransformer. Under Search Applications, the only option is “default”. Later, a custom app can be added to the list.
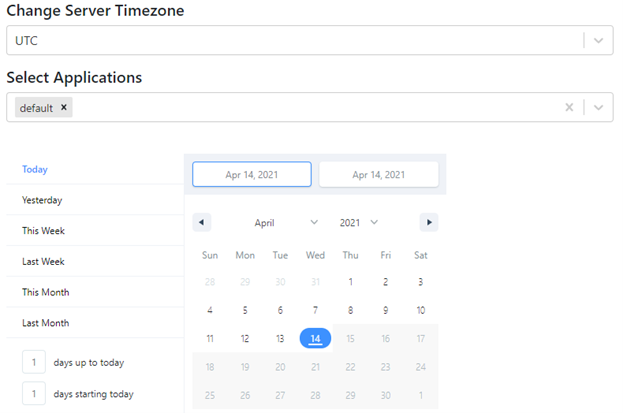
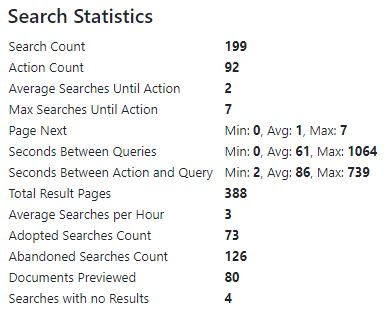
On the calendar, select the timeframe for which you would like to see the Query Logs. After selecting, the overall statistics will be displayed, as well as a graphical view expanded out per day or per hour if only one day was selected.

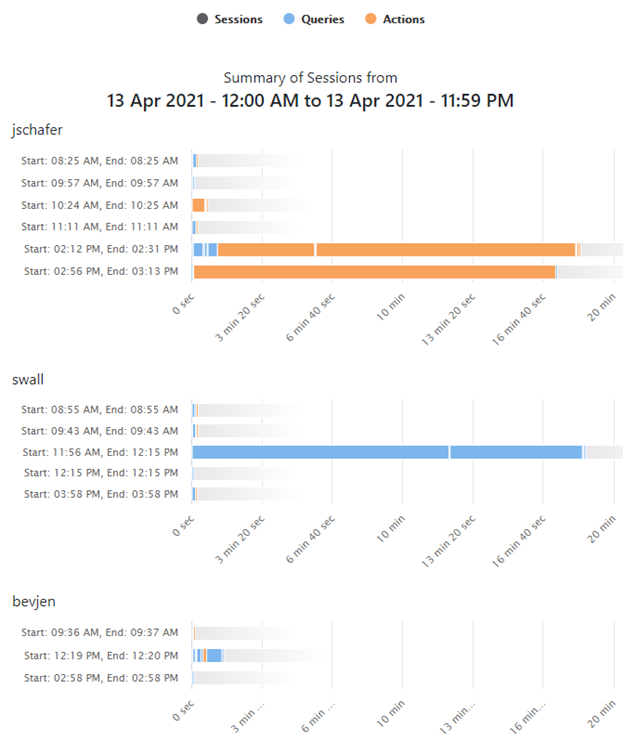
Finally, clicking on an individual day will show a more detailed report of that day, as well as the users who are performing the actions.
The above graphs are showing all searches within our Mindbreeze instance, which includes multiple applications (employee portal, document management system, public website). To view reports specific to each use case, simply tell Mindbreeze which searches belong to which Search Application. To do so, go back to the Personalized Relevance Transformer configuration.
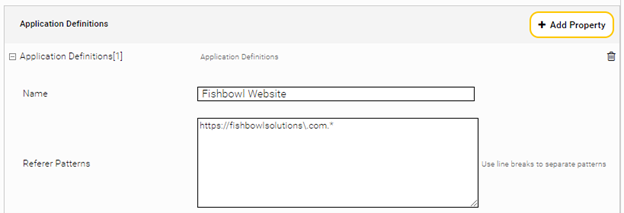
In the Personalized Relevance Transformer configuration, add a new property under “Application Definitions”. Give a name to this application and add all the Referrer Patterns using Java regular expressions for where the searches are coming from. In my example, I want to have an application specific to our website search, so my referrer pattern is simply anything beginning with our Fishbowl Solutions website URL.
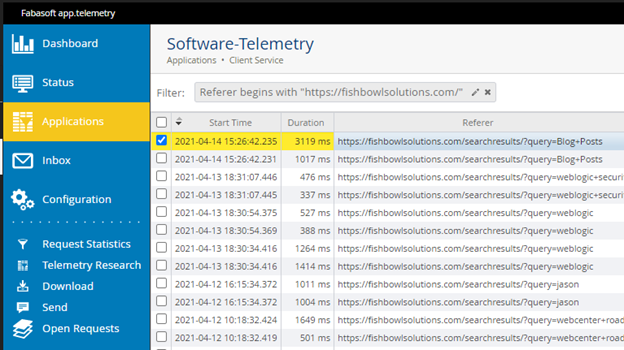
If unsure what the Referrer is for your application, you can find them in the app.telemetry logs.
Go to app.telemetry → Applications → Client Service → View Telemetry Data and find the column “Referer”.
Now that the Application Definition has been added to the Personalized Relevance Transformer configuration, go back to the Query Logs page. In the Select Applications dropdown, the ability to filter reporting to only searches from the application is now available.

Understanding how your users are interacting with the search and making incremental changes over time allows you to increase the overall search experience and Mindbreeze’s effectiveness. With Mindbreeze’s Query Logs Reporting, we can see those types of interactions, and even scope them to specific search applications to drive further insight.
If you’re interested in learning more about improving your Mindbreeze Inspire appliance, please contact us at info@fishbowlsolutions.com or visit our Mindbreeze services page to learn how to get the most out of your enterprise search investment.


0 Comments